| |
2000 |
2001 |
2002 |
2003 |
2004 |
2005 |
2006 |
2007 |
2008 |
2009 |
2010 |
11,038 |
11,871 |
12,474 |
12,497 |
13,163 |
13,973 |
13,814 |
15,012 |
15,660 |
16,061 |
15,791 |
2011 |
2012 |
2013 |
2014 |
2015 |
2016 |
2017 |
2018 |
|
|
|
16,303 |
16,405 |
17,215 |
17,299 |
18,650 |
19,229 |
19,520 |
20,331 |
|
|
|
|
| |
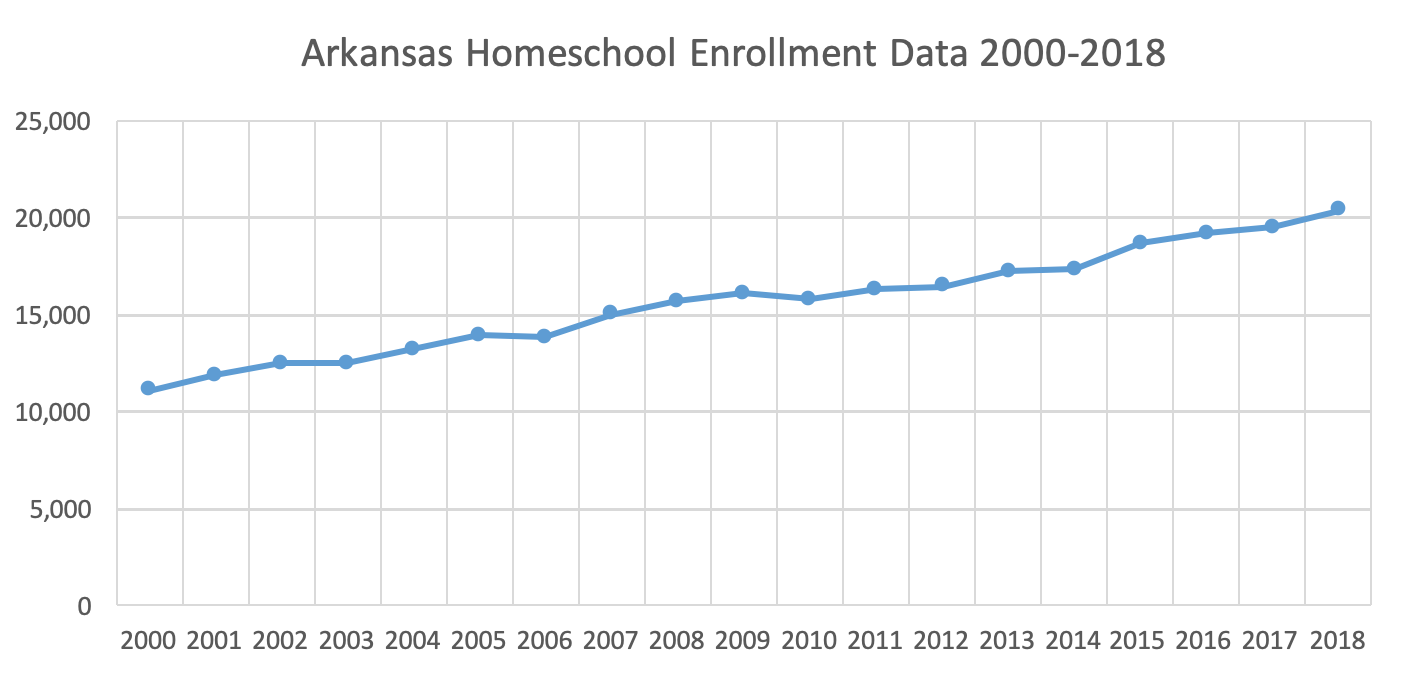 |
Arkansas data obtained from:
1997-2013: 2013: http://www.arkansased.gov/public/userfiles/Learning_Services/Charter%20and%20Home%20School/Home%20School-Division%20of%20Learning%20Services/2012_2013_Home_School_Report.pdf
2014: http://www.arkansased.gov/public/userfiles/Learning_Services/Charter%20and%20Home%20School/Home%20School-Division%20of%20Learning%20Services/2013_2014_Home_School_Report.pdf
2015-2016: Cindy M. Hogue (cindy.Hogue@arkansas.gov).
2016-2017: http://www.arkansased.gov/public/userfiles/Learning_Services/Charter%20and%20Home%20School/Home%20School-Division%20of%20Learning%20Services/2016-2017_Arkansas_Home_School_Report.pdf
2017-2018:
http://dese.ade.arkansas.gov/public/userfiles/Learning_Services/Charter%20and%20Home%20School/Home%20School-Division%20of%20Learning%20Services/2017-2018_Arkansas_Home_School_Report.pdf |
|
| |
2000 |
2001 |
2002 |
2003 |
2004 |
2005 |
2006 |
2007 |
2008 |
2009 |
2010 |
9,380 |
9,680 |
8,910 |
8,591 |
7,081 |
6,335 |
5,663 |
6,909 |
6,684 |
6,501 |
6,462 |
2011 |
2012 |
2013 |
2014 |
2015 |
2016 |
2017 |
2018 |
|
|
|
6,067 |
5,741 |
7,489 |
8,009 |
8,606 |
7,659 |
7,387 |
9,284 |
|
|
|
|
| |
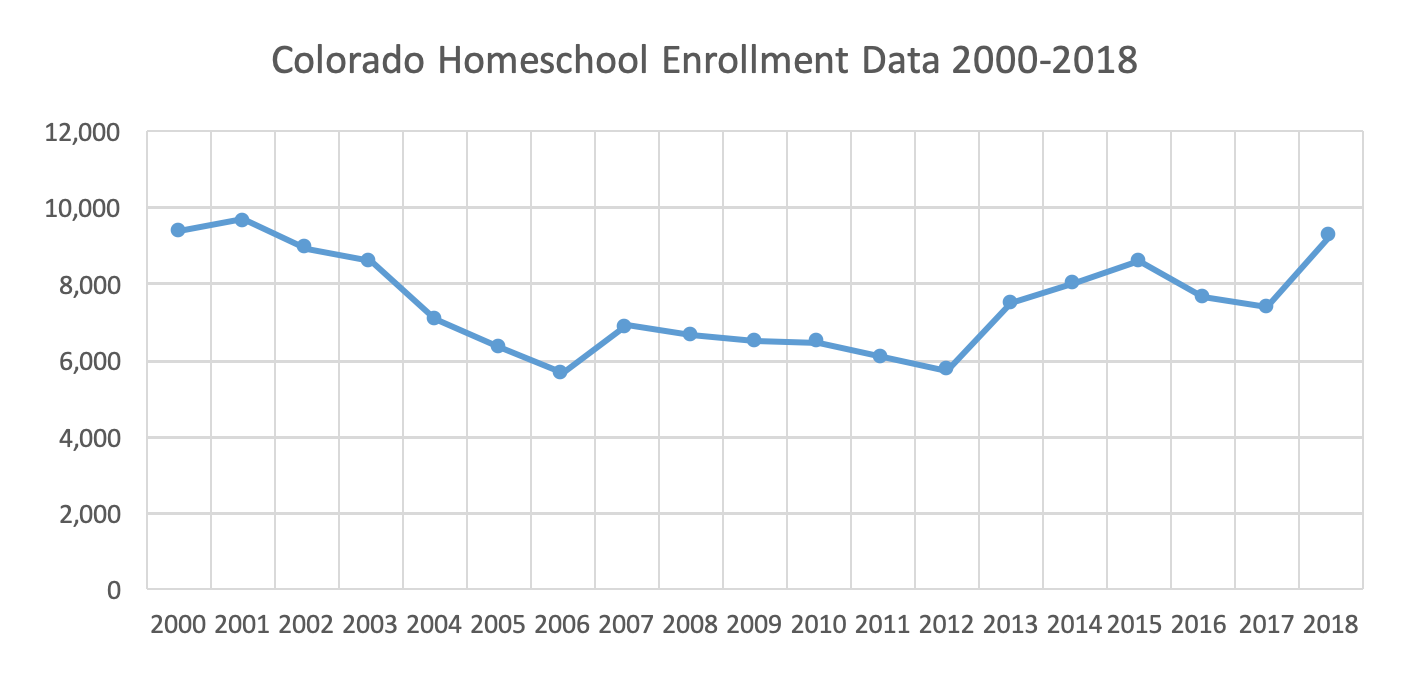 |
Colorado data obtained from:
2003-2007: http://www.cde.state.co.us/cdereval/rv2007pmlinks.htm
2009-2016: http://www.cde.state.co.us/cdereval/pupilcurrenthomebased2016-2017: http://www.cde.state.co.us/cdereval/pupilcurrent
2018-2019: http://www.cde.state.co.us/cdereval/pupilcurrent
|
|
| |
2000 |
2001 |
2002 |
2003 |
2004 |
2005 |
2006 |
2007 |
2008 |
2009 |
2010 |
2,193 |
2,266 |
2,418 |
2,269 |
2,166 |
2,070 |
2,099 |
2,046 |
1,886 |
1,931 |
1,886 |
2011 |
2012 |
1,945 |
1,836 |
|
| |
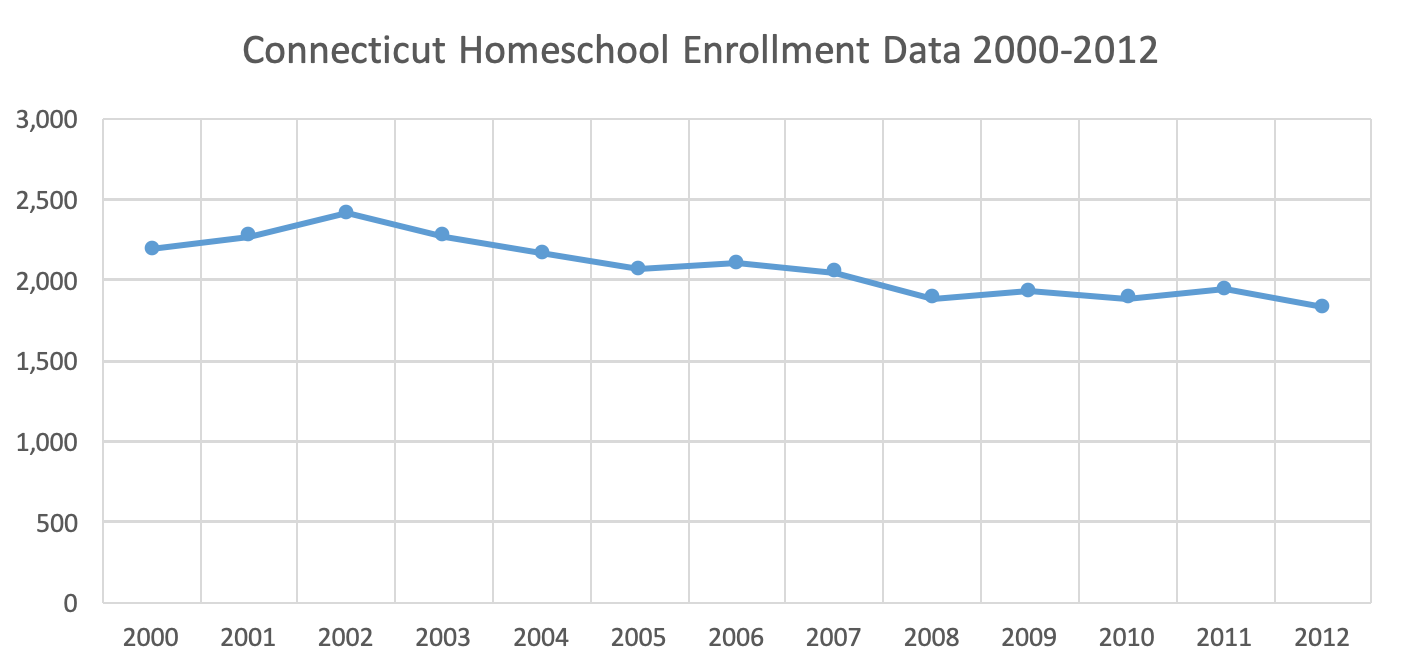 |
Connecticut data obtained from:
2000-2006:
Also taken from data sent via email correspondence with David D. Twedt, Bureau of Grants Management ()
2013-2016: According to David Twedt (david.twedt@ct.gov), Connecticut stopped collecting homeschool enrollment data after the 2012-2013 school year.
Checked again in 2019- Marcy Reed (Education Consultant) marcy.reed@ct.gov explained the state does not collect this data.
|
|
| |
2000 |
2001 |
2002 |
2003 |
2004 |
2005 |
2006 |
2007 |
2008 |
2009 |
2010 |
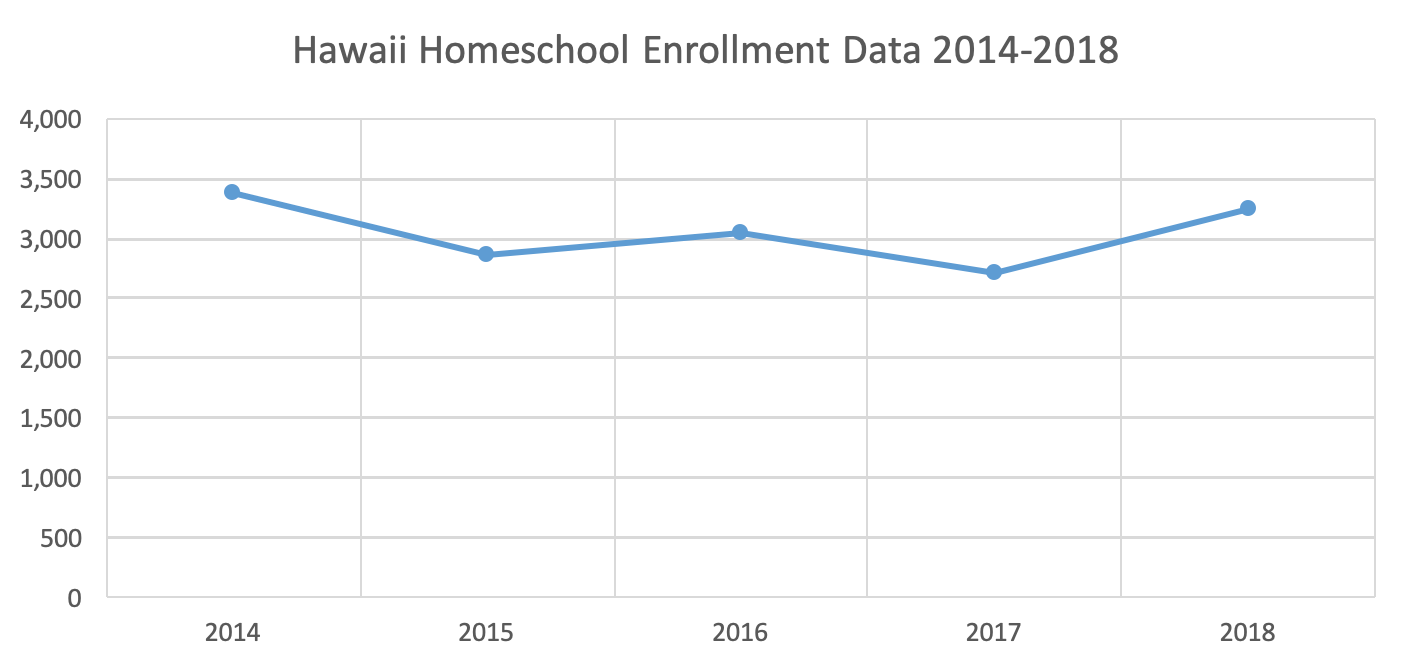
2,174 |
2,288 |
2,290 |
2,287 |
2,418 |
2,563 |
2,484 |
2,538 |
2,558 |
2,606 |
2,713 |
2011 |
2012 |
2013 |
2014 |
2015 |
2016 |
2017 |
2018 |
|
|
|
2,700 |
2,765 |
3,196 |
2,720 |
2,609 |
3,051 |
2,948 |
3,026 |
|
|
|
|
| |
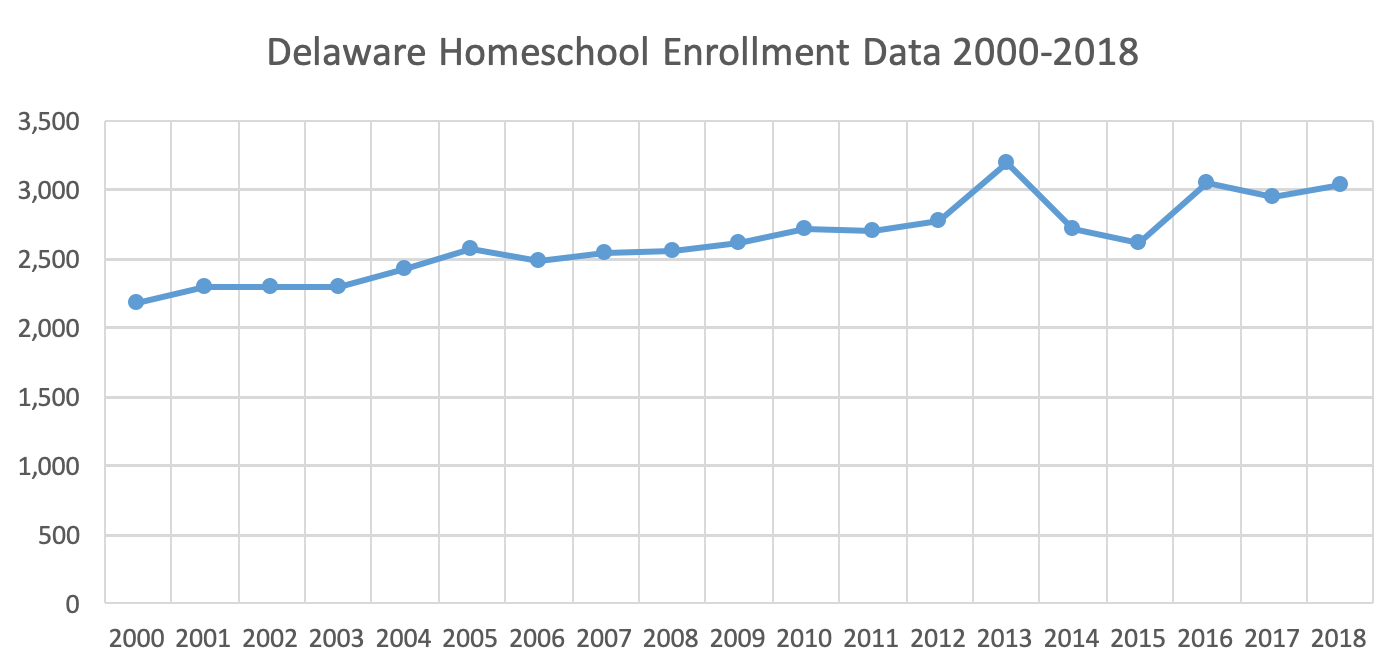 |
Delaware data obtained from:
|
|
| |
2000 |
2001 |
2002 |
2003 |
2004 |
2005 |
2006 |
2007 |
2008 |
2009 |
2010 |
37,196 |
41,128 |
44,460 |
45,333 |
47,151 |
51,110 |
55,822 |
56,650 |
60,913 |
62,567 |
69,281 |
2011 |
2012 |
2013 |
2014 |
2015 |
2016 |
2017 |
2018 |
|
|
|
72,408 |
75,801 |
77,054 |
84,096 |
83,359 |
87,462 |
87,462 |
89,817 |
|
|
|
|
| |
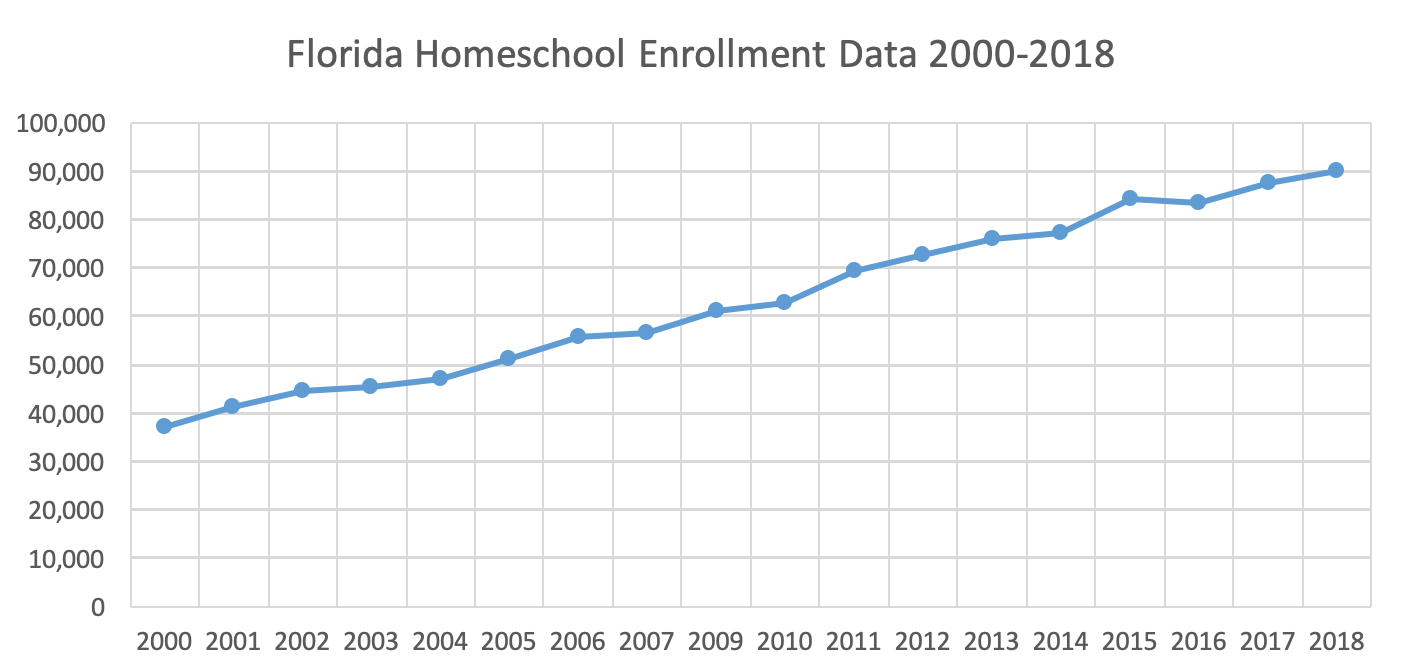 |
Florida data obtained from:
2013:
2014:
2015:
2016: http://www.fldoe.org/core/fileparse.php/5606/urlt/Home-Education-Annual-Report-2016-17.pdf
2018: http://www.fldoe.org/core/fileparse.php/5606/urlt/Home-Ed-Annual-Report-2017-18.pdf |
|
| |
2000 |
2001 |
2002 |
2003 |
2004 |
2005 |
2006 |
2007 |
2008 |
2009 |
2010 |
28,898 |
32,309 |
31,831 |
34,363 |
36,413 |
36,624 |
39,477 |
42,843 |
39,233 |
40,510 |
42,474 |
2011 |
2012 |
2013 |
2014 |
2015 |
2016 |
2017 |
2018 |
2019 |
|
|
N/A |
N/A |
18,064 |
62,582 |
58,806 |
61,527 |
64,799 |
66,149 |
74,066 |
|
|
|
| |
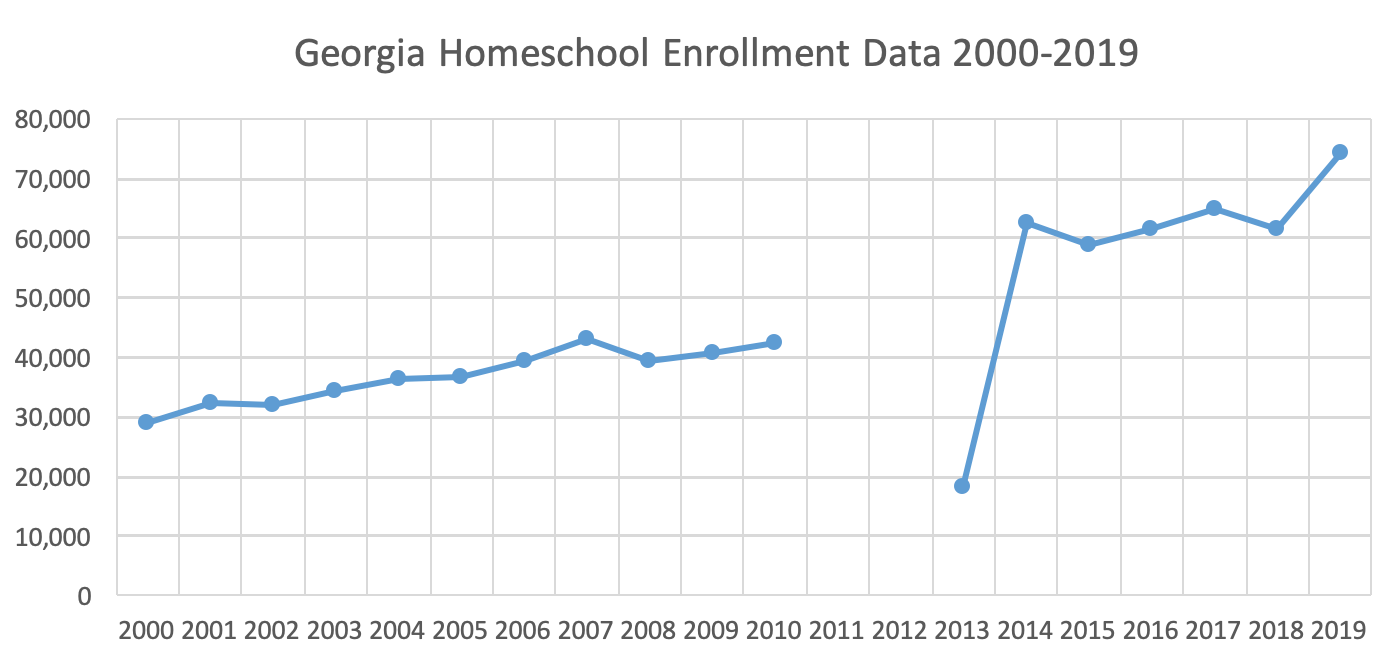 |
Georgia data obtained from:
2014: Albert Blenke:
2011-2016: Julie James ()
2017: Jeffrey Hodges (jHodges@doe.k12.ga.us)
2018 & 2019: Jeff Hodges has been reassigned and no longer working with the homeschool program. All homeschool inquiries should be sent to homeschool@doe.k12.ga.us
submit a request electronically through online Data Request Form using the link below.
https://www.gadoe.org/Technology-Services/Data-Collections/_layouts/SPApps/DataRequestForm.aspx |
|
|
|
| |
2000 |
2001 |
2002 |
2003 |
2004 |
2005 |
2006 |
2007 |
2008 |
2009 |
2010 |
N/A |
N/A |
5,865 |
6,392 |
6,252 |
7,874 |
7,829 |
7,856 |
8,120 |
7,817 |
8,440 |
2011 |
2012 |
2013 |
2014 |
2015 |
2016 |
2017 |
2018 |
2019 |
|
|
9,059 |
9,670 |
9,798 |
10,034 |
12,266 |
12,177 |
13,263 |
13,708 |
13,672 |
|
|
|
| |
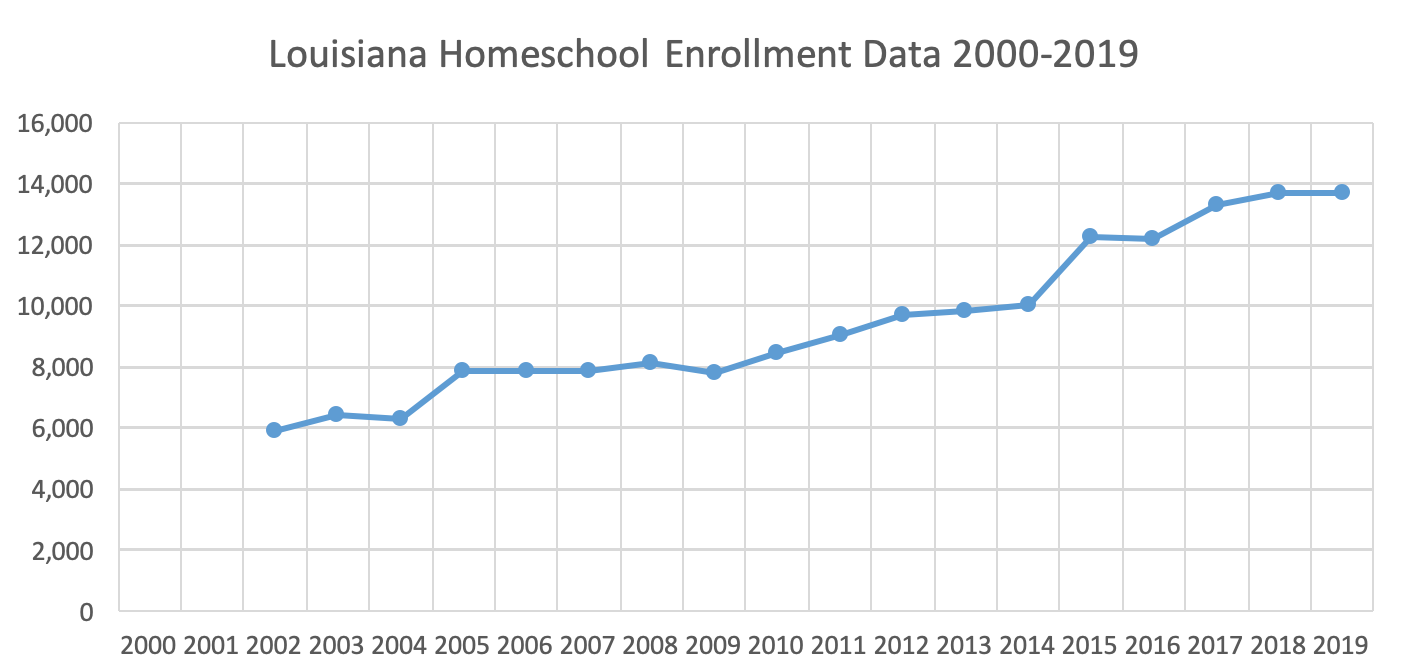 |
Louisiana Public Records (ldepublicrecords@la.gov) |
|
| |
2000 |
2001 |
2002 |
2003 |
2004 |
2005 |
2006 |
2007 |
2008 |
2009 |
2010 |
4,375 |
4,595 |
3,483 |
4,718 |
4,076 |
4,712 |
4,567 |
4,994 |
4,998 |
5,009 |
4,777 |
2011 |
2012 |
2013 |
2014 |
2015 |
2016 |
2017 |
2018 |
|
|
|
4,730 |
4,995 |
5,024 |
5,561 |
5,441 |
5,467 |
5,275 |
5,749 |
|
|
|
|
| |
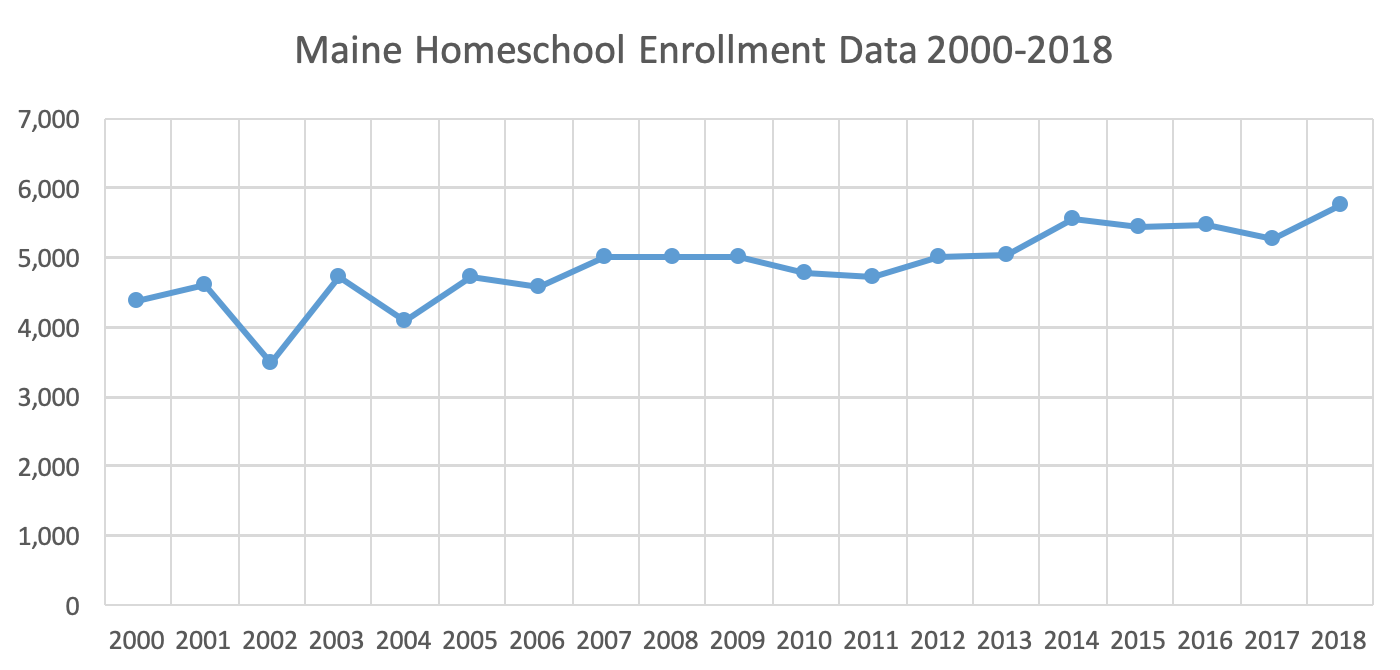 |
Maine data obtained from:
2013-2014: Randy Kassa:
2015-2016: Information is "not available at this time" according to
2017: http://www.maine.gov/doe/homeinstruction/faq.html
2018: https://www.maine.gov/doe/schools/schoolops/homeinstruction/faq |
|
| |
2000 |
2001 |
2002 |
2003 |
2004 |
2005 |
2006 |
2007 |
2008 |
2009 |
2010 |
17,383 |
19,423 |
20,676 |
21,205 |
23,746 |
24,329 |
24,277 |
25,215 |
24,634 |
23,287 |
22,110 |
2011 |
2012 |
2013 |
2014 |
2015 |
2016 |
2017 |
2018 |
|
|
|
23,069 |
24,302 |
26,434 |
26,975 |
27,742 |
27,829 |
26,040 |
27,561 |
|
|
|
|
| |
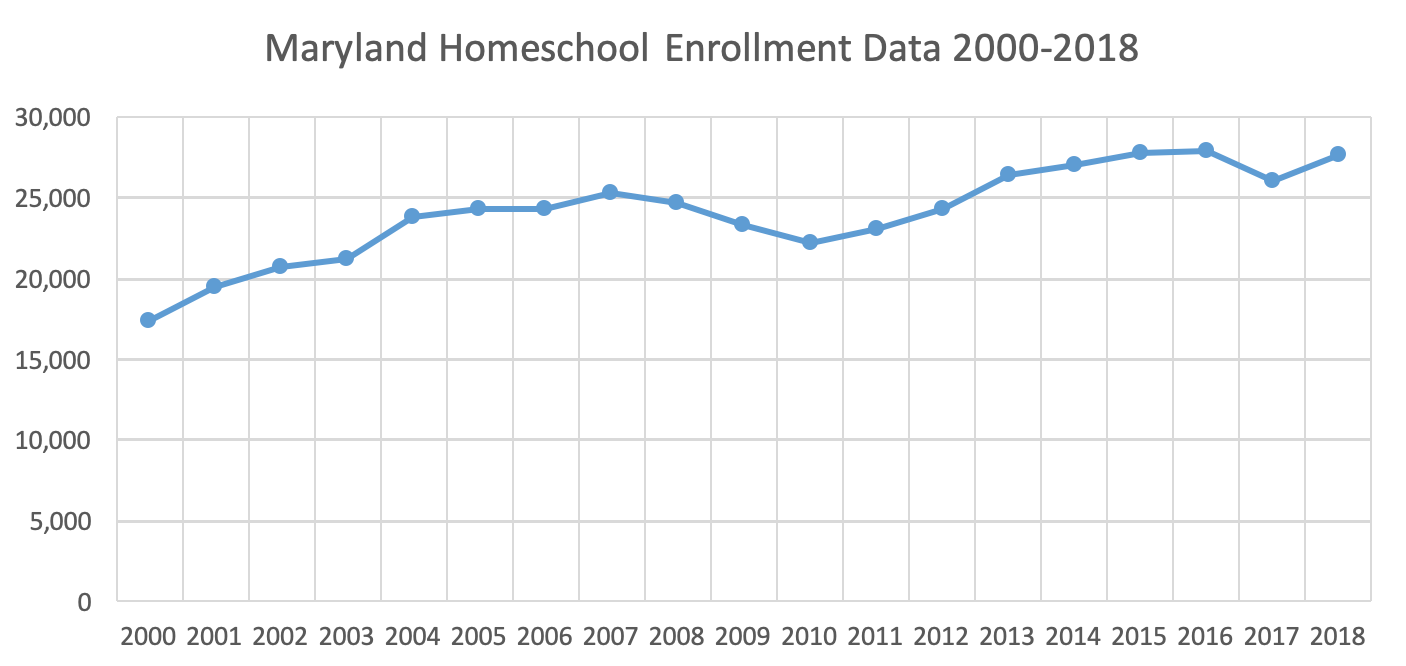 |
Maryland data obtained from:
1993-2000: (Home Schooling 12-Year Report)
2001-2013: Richard Scott ()
2014-2015: Walter Sallee ()
2017-2018 & 2018-2019:
http://marylandpublicschools.org/about/Documents/DSFSS/SSSP/HomeInstruct/HomeSchool14YearReport20042018.pdf |
|
|
| |
2000 |
2001 |
2002 |
2003 |
2004 |
2005 |
2006 |
2007 |
2008 |
2009 |
2010 |
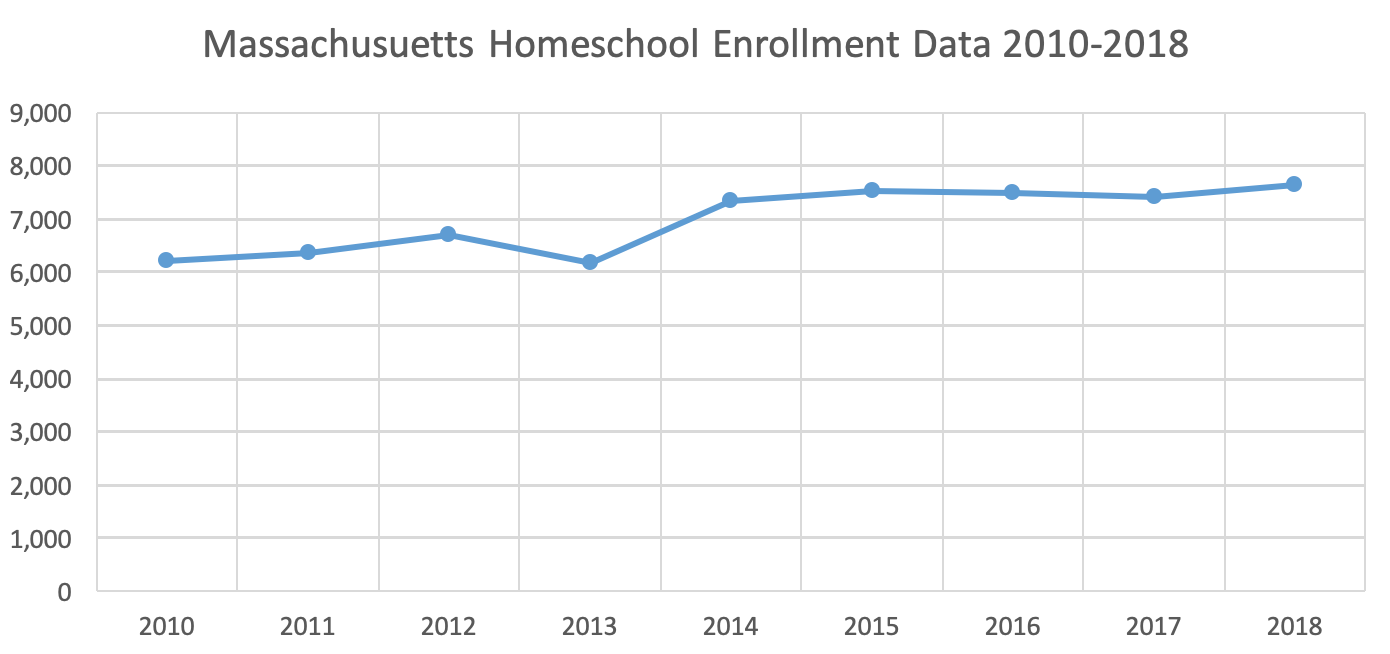
15,249 |
15,610 |
16,519 |
17,533 |
17,135 |
17,334 |
17,631 |
15,256 |
15,653 |
N/A |
17,247 |
2011 |
2012 |
2013 |
2014 |
2015 |
2016 |
2017 |
|
|
|
|
16,081 |
16,373 |
17,451 |
18,085 |
18,772 |
12,927 |
18,988 |
|
|
|
|
|
| |
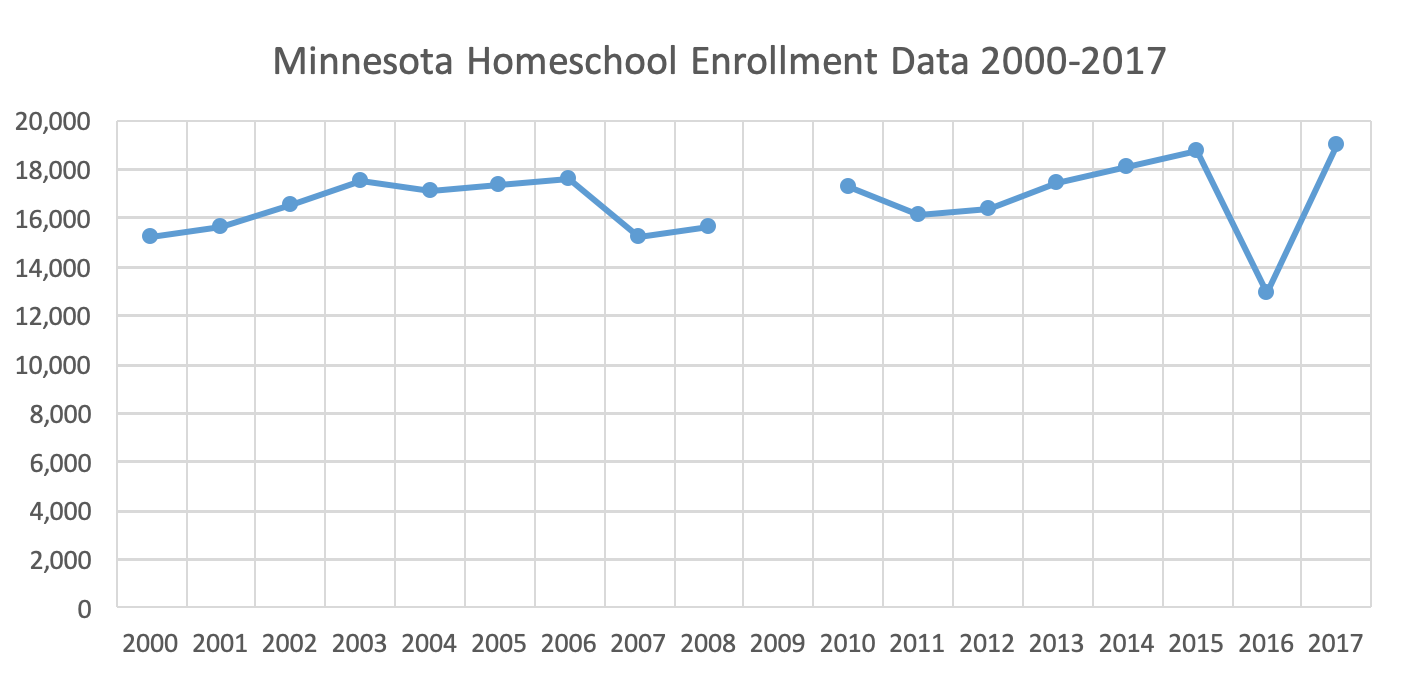 |
Minnesota data obtained from:
2005-2013: (Select “Schools and Districts” from under the District Information heading. Then, choose “Education Statistics Summary” as the subcategory).
2014-2015:
2014-2017: http://w20.education.state.mn.us/MDEAnalytics/Summary.jsp |
|
| |
2000 |
2001 |
2002 |
2003 |
2004 |
2005 |
2006 |
2007 |
2008 |
2009 |
2010 |
3,627 |
3,571 |
3,788 |
3,917 |
3,971 |
3,987 |
4,093 |
4,106 |
4,028 |
4,079 |
4,269 |
2011 |
2012 |
2013 |
2014 |
2015 |
2016 |
2017 |
2018 |
|
|
|
4,260 |
4,329 |
4,694 |
4,954 |
5,003 |
5,273 |
5,390 |
5,743 |
|
|
|
|
| |
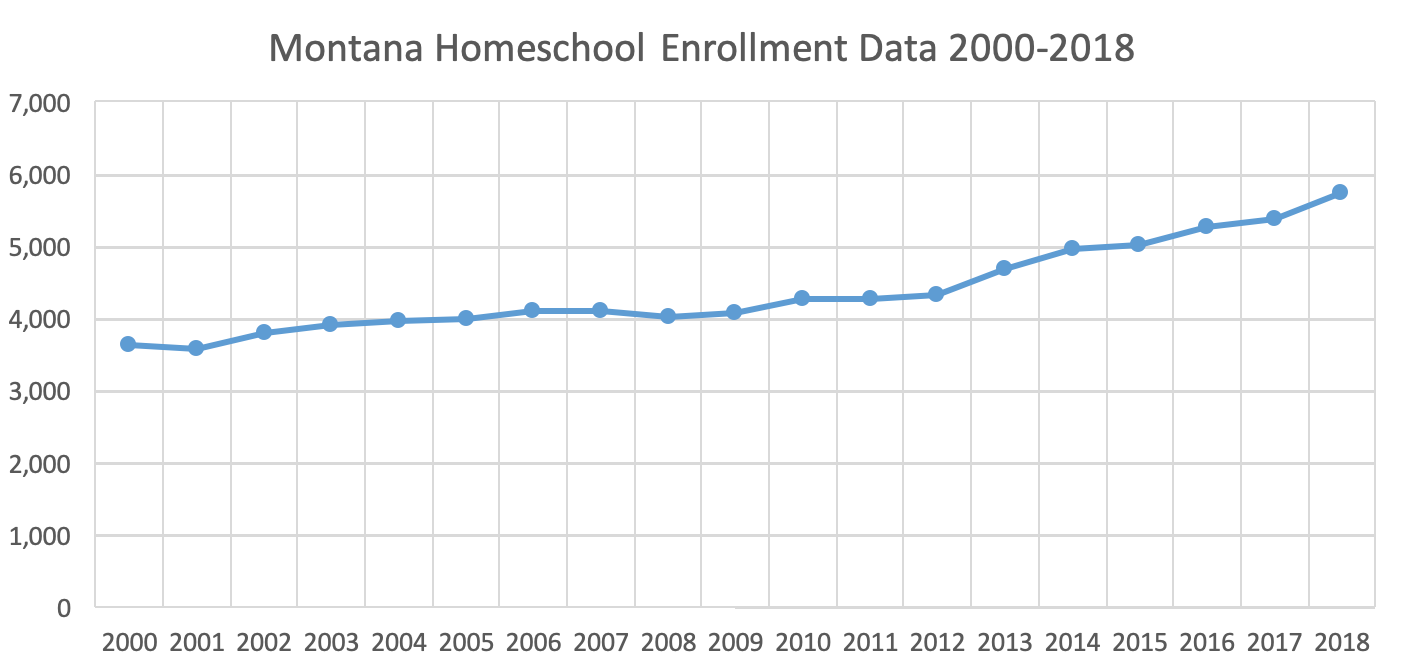 |
Montana data obtained from:
2012-2014:
2015:
2016: Linden Miller ()
2017-2018: Andrew Boehm (aboehm@mt.gov) |
|
| |
2000 |
2001 |
2002 |
2003 |
2004 |
2005 |
2006 |
2007 |
2008 |
2009 |
2010 |
4,659 |
5,000 |
5,086 |
4,929 |
4,976 |
5,616 |
5,956 |
6,062 |
6,134 |
6,295 |
6,540 |
2011 |
2012 |
2013 |
2014 |
2015 |
|
|
|
|
|
|
6,809 |
7,200 |
7,674 |
8,095 |
8,290 |
|
|
|
|
|
|
|
| |
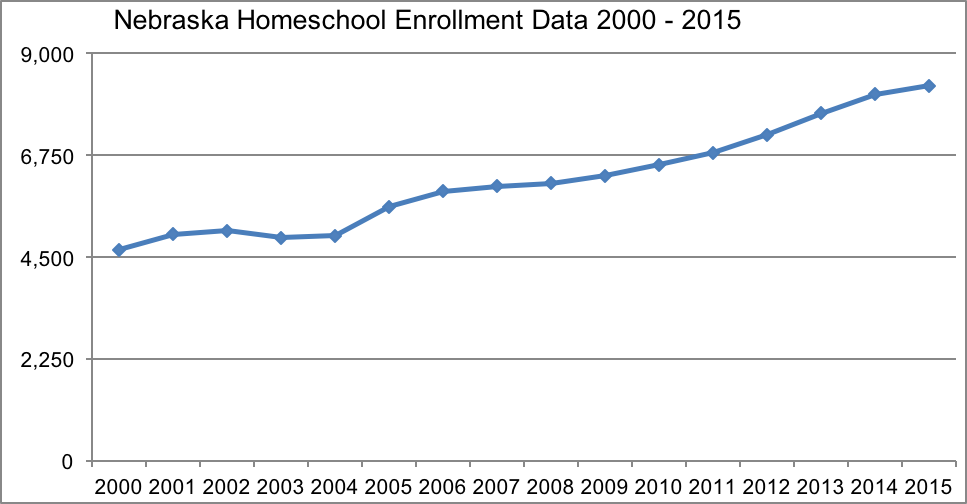 |
Nebraska data obtained from:
|
|
| |
2000 |
2001 |
2002 |
2003 |
2004 |
2005 |
2006 |
2007 |
2008 |
2009 |
2010 |
3,895 |
4,105 |
4,319 |
4,343 |
4,503 |
4,506 |
4,599 |
4,639 |
4,800 |
5,113 |
5,395 |
2011 |
2012 |
2013 |
2014 |
2015 |
2016 |
|
|
|
|
|
5,285 |
5,553 |
5,914 |
6,655 |
|
|
|
|
|
|
|
|
| |
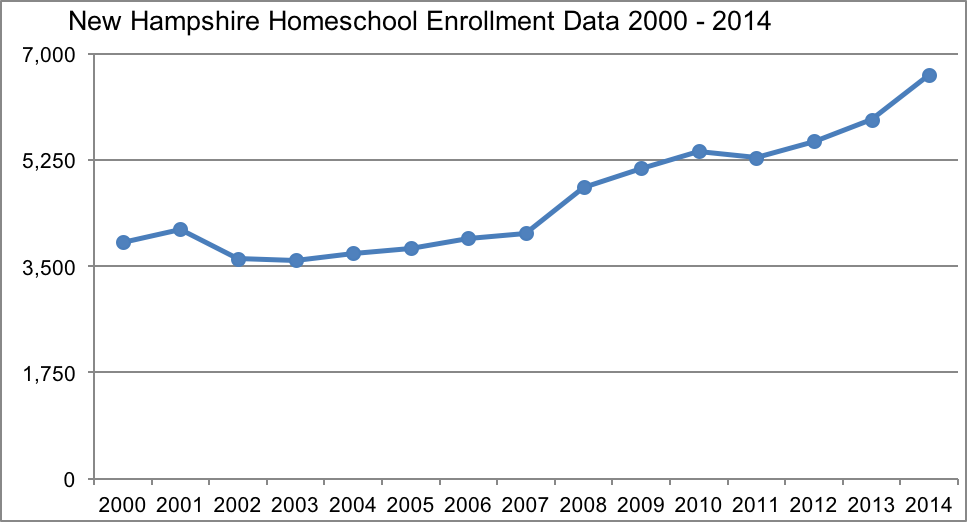 |
New Hampshire data obtained from:
2012:
2013:
2014:
2015-2016: According to New Hampshire no longer collects this data: “A decision was made not to collect the Home Education data through a survey in the Education Statistics System. Parents who home school their children are only required to notify the DOE, the district superintendent, or a nonpublic school within 5 business days of starting a home education program. Therefore, the data the Department would receive would not be complete.” |
|
| |
2000 |
2001 |
2002 |
2003 |
2004 |
2005 |
2006 |
2007 |
2008 |
2009 |
2010 |
N/A |
N/A |
N/A |
N/A |
N/A |
N/A |
N/A |
N/A |
N/A |
N/A |
N/A |
2011 |
2012 |
2013 |
2014 |
2015 |
2016 |
2017 |
2018 |
2019 |
|
|
N/A |
N/A |
N/A |
N/A |
59 |
72 |
97 |
N/A |
7,858 |
|
|
|
| |
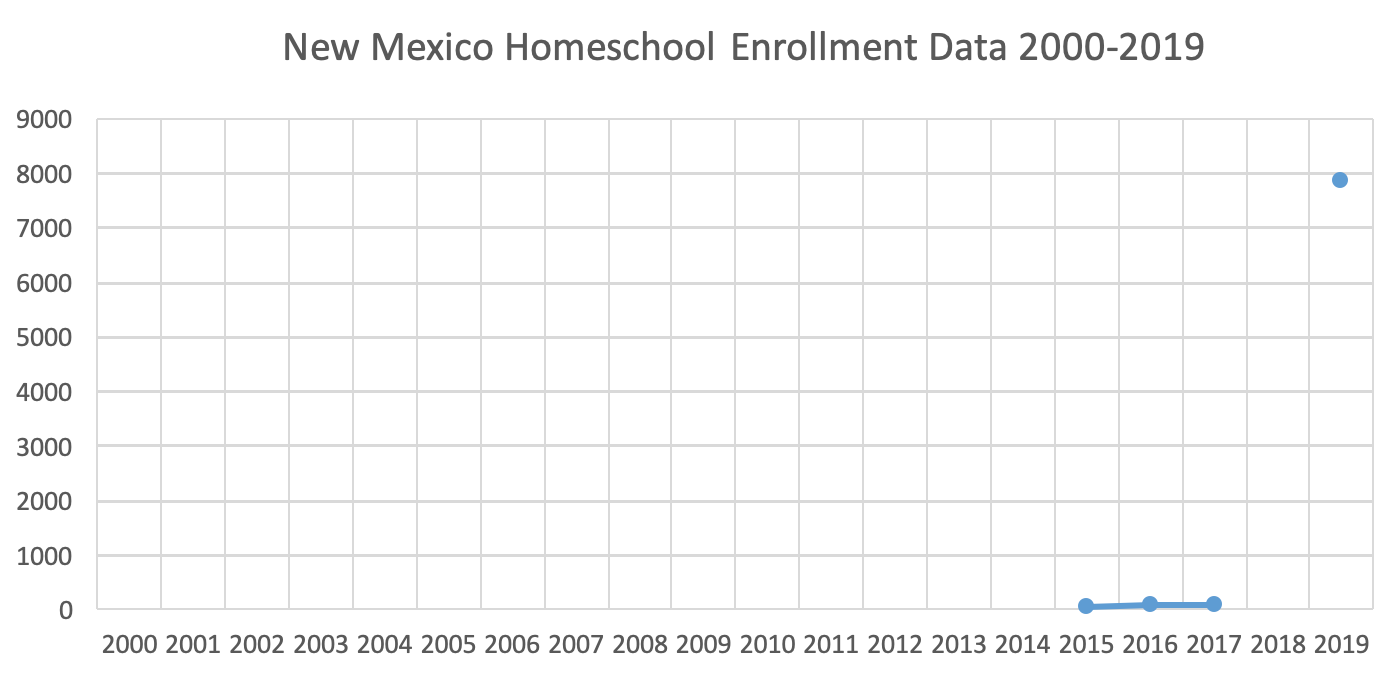 |
2015-2017 & 2019: Beverly Friedman (Bev.Friedman@state.nm.us) |
|
| |
2000 |
2001 |
2002 |
2003 |
2004 |
2005 |
2006 |
2007 |
2008 |
2009 |
2010 |
33,860 |
46,909 |
51,571 |
54,501 |
58,780 |
64,378 |
68,707 |
71,566 |
77,065 |
81,509 |
83,609 |
2011 |
2012 |
2013 |
2014 |
2015 |
2016 |
2017 |
2018 |
|
|
|
79,693 |
87,978 |
98,172 |
106,853 |
118,268 |
127,847 |
135,749 |
142,037 |
|
|
|
|
| |
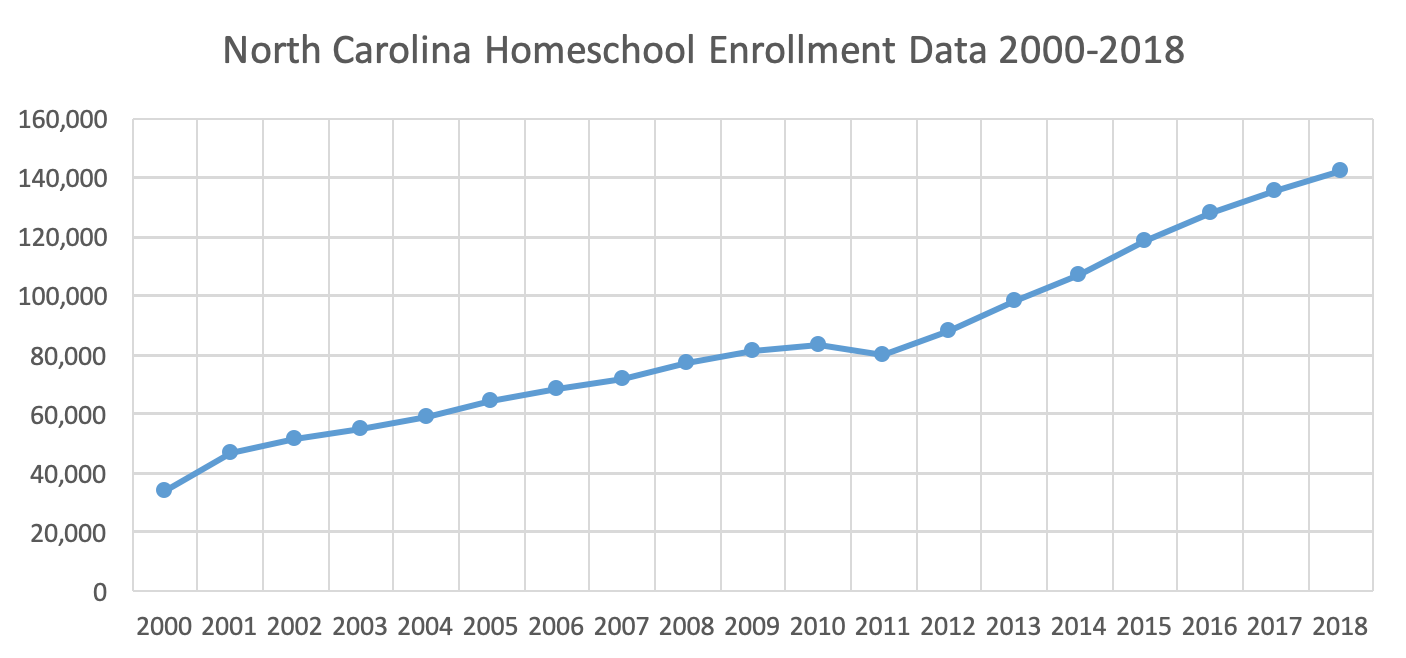 |
North Carolina data obtained from:
|
|
| |
2007 |
2008 |
2009 |
2010 |
2011 |
2012 |
2013 |
2014 |
2015 |
2016 |
2017 |
2018 |
1,478 |
1,543 |
1,494 |
1,683 |
1,891 |
2,048 |
2,359 |
2.764 |
2,858 |
2,067 |
3,078 |
3,456 |
|
| |
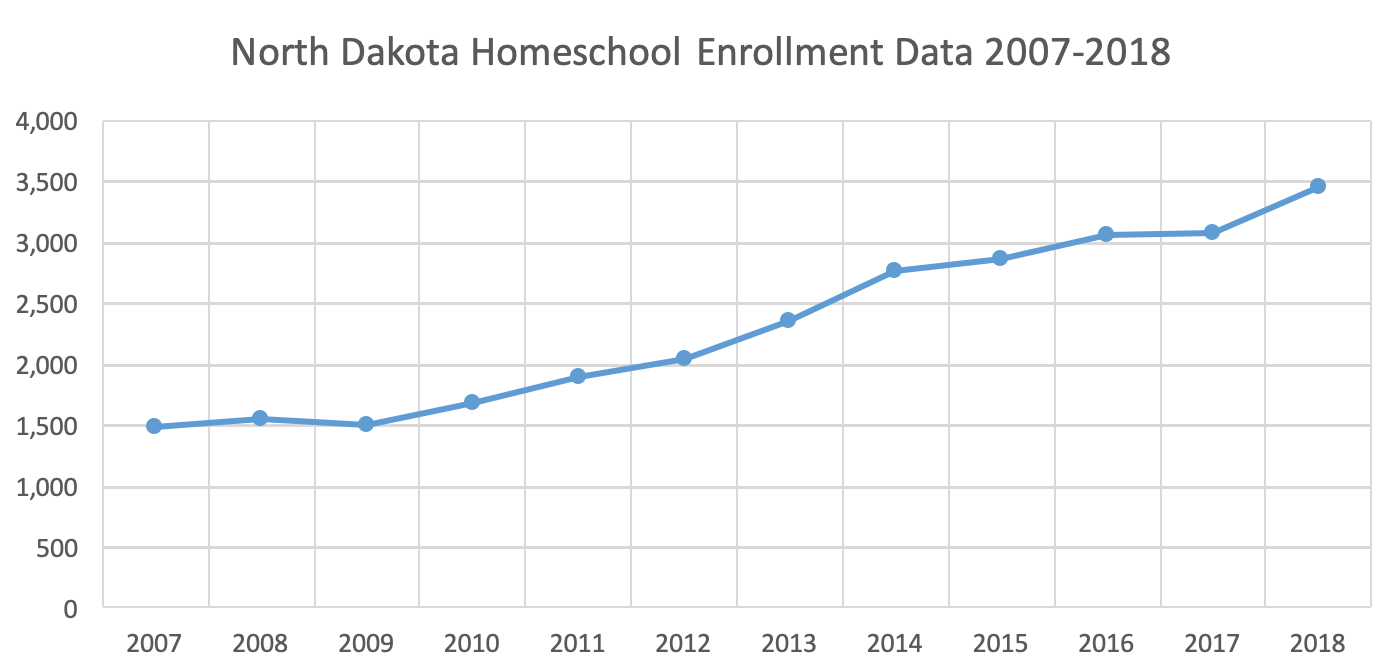 |
Joe Kolosky (jkolosky@nd.gov)
|
|
| |
2000 |
2001 |
2002 |
2003 |
2004 |
2005 |
2006 |
2007 |
2008 |
2009 |
2010 |
N/A |
N/A |
N/A |
N/A |
N/A |
26,694 |
23,733 |
24,770 |
23,835 |
23,715 |
22,171 |
2011 |
2012 |
2013 |
2014 |
2015 |
2016 |
2016 |
|
|
|
|
N/A |
N/A |
N/A |
N/A |
N/A |
28,539 |
30,461 |
|
|
|
|
|
| |
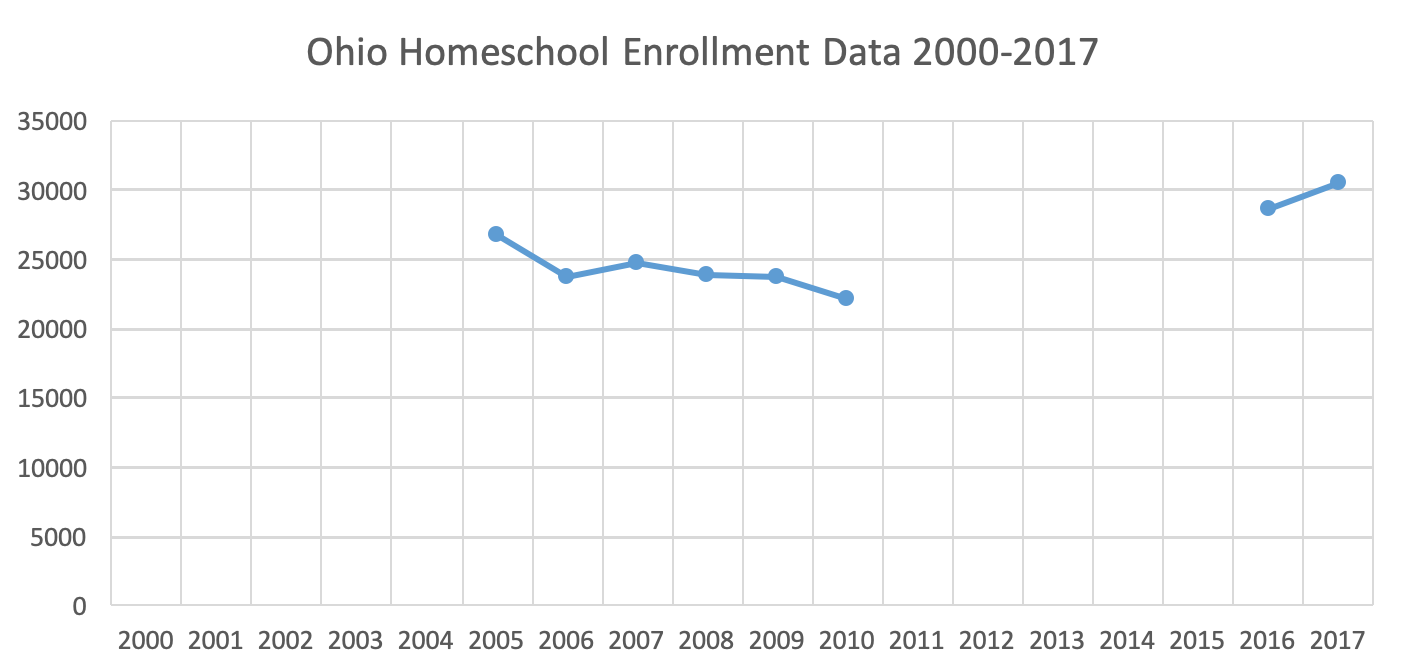 |
Taken from data sent via email correspondence with Nina Pace, ODOE Nonpublic Educational Operations Coordinator (email sent to , statistics reflective of correct district reporting of parent intention to homeschool).
2010:
2011-2016: According to HomeEdRules@education.ohio.gov, their office does not collect the data
2017: http://education.ohio.gov/Media/Facts-and-Figures
|
|
| |
2000 |
2001 |
2002 |
2003 |
2004 |
2005 |
2006 |
2007 |
2008 |
2009 |
2010 |
14,509 |
N/A |
20,464 |
20,401 |
21,192 |
18,860 |
15,220 |
17,915 |
20,846 |
20,617 |
21,154 |
2011 |
2012 |
2013 |
2014 |
2015 |
2016 |
2017 |
|
|
|
|
19,900 |
20,188 |
N/A |
N/A |
22,767 |
22,353 |
22,956 |
|
|
|
|
|
| |
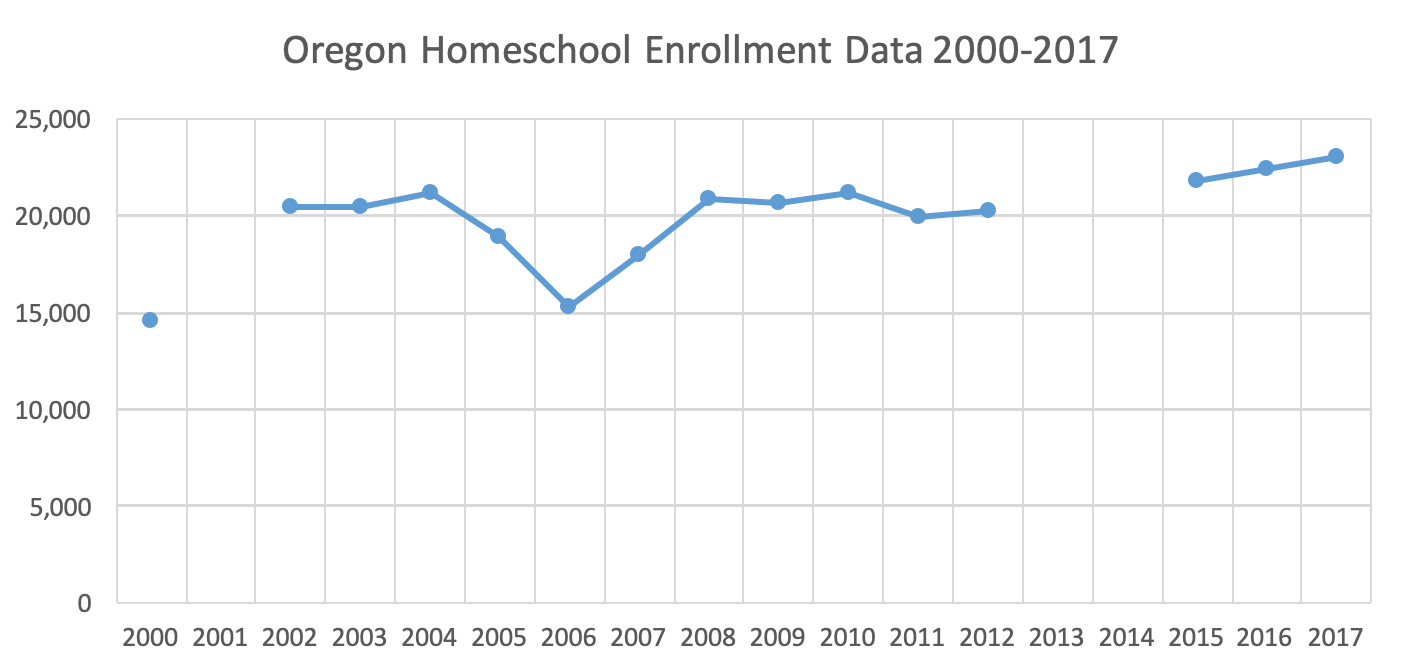 |
Oregon data obtained from:
1997-2012:
2015: |
|
| |
2000 |
2001 |
2002 |
2003 |
2004 |
2005 |
2006 |
2007 |
2008 |
2009 |
2010 |
24,019 |
23,903 |
24,415 |
24,076 |
23,287 |
22,412 |
22,136 |
21,751 |
21,553 |
21,240 |
N/A |
2011 |
2012 |
2013 |
2014 |
2015 |
2016 |
2017 |
2018 |
|
|
|
20,897 |
N/A |
N/A |
N/A |
22,363 |
23,894 |
24,146 |
24,658 |
|
|
|
|
| |
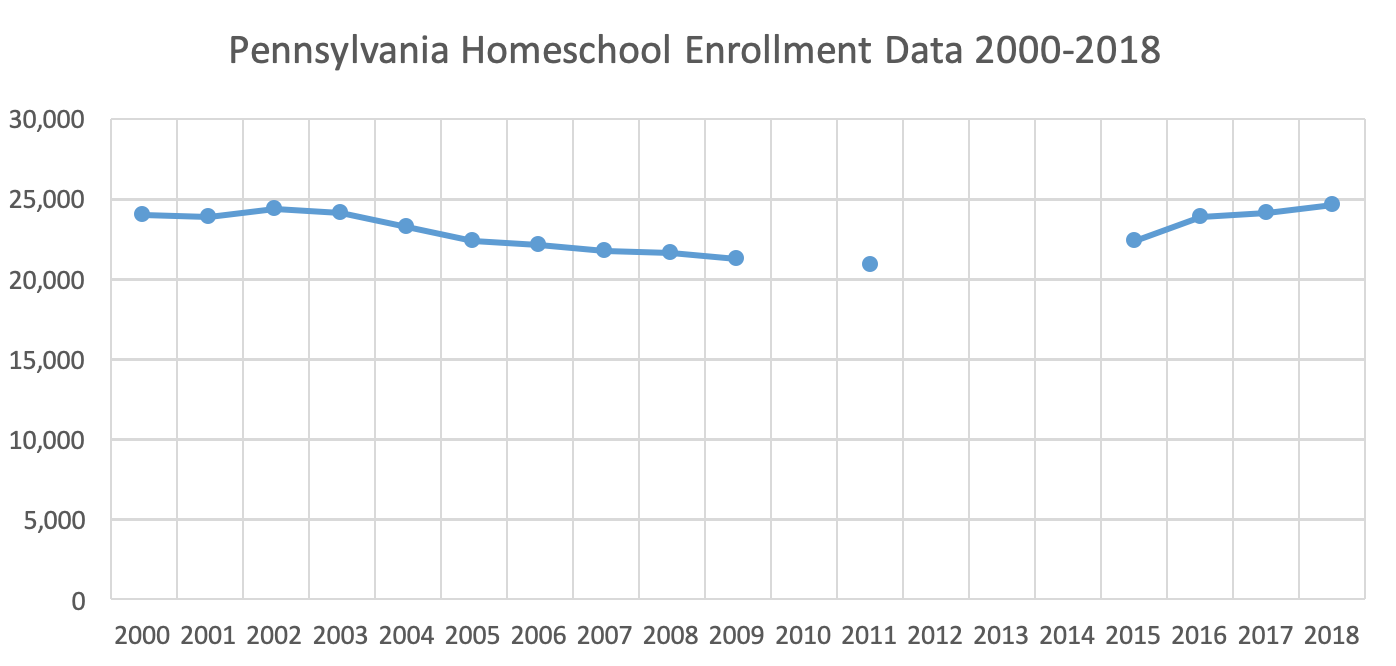 |
Pennsylvania data taken from:
2007-2011: Statistics taken from data sent via email correspondence with Rosanne Cramer, PDE Division of Data Quality (email sent to ). Taken from data sent via email correspondence with Suzanne Tallman, Home Education & Private Tutoring Advisor ()
2012-2016: Taken from correspondence with , “A number of years ago the individual in the Division of Data Quality retired who was responsible for this collection and was not replaced. The responsibility eventually was shifted to the School Services Office where there also was not enough staff to maintain the collection. In 2015, we incorporated the Home Education and Private Tutoring Report into the PIMS collection so we expect that the collections will resume. If eventually we are able to reconstruct the information from previous years, we will. The best thing you can do is to check periodically the webpages for for updates. That is where the information will be posted.
2015- 2018: https://www.education.pa.gov/DataAndReporting/HomeSchool/Pages/default.aspx
|
|
| |
2000 |
2001 |
2002 |
2003 |
2004 |
2005 |
2006 |
2007 |
2008 |
2009 |
2010 |
N/A |
N/A |
N/A |
N/A |
901 |
852 |
811 |
981 |
983 |
1,134 |
1,270 |
2011 |
2012 |
2013 |
2014 |
2015 |
2016 |
2017 |
2018 |
1,273 |
1,240 |
1,513 |
1,527 |
1,527 |
1,550 |
1,648 |
1,764 |
|
| |
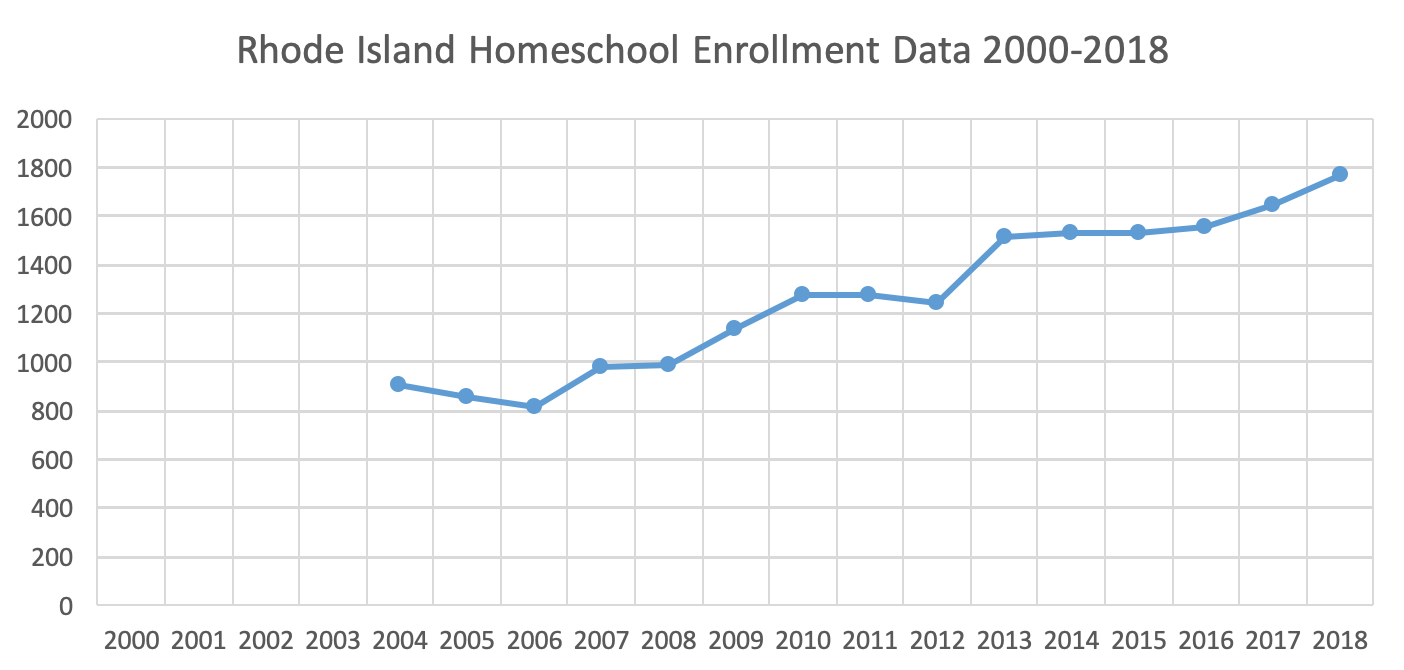 |
Vilma L. DiOrio (vilma.diorio@ride.ri.gov)
Melissa Robb: melissa.robb@enrichri.org
The data is on the RIDE website in FRED. Search for home https://datacenter.ride.ri.gov/fred. |
|
| |
2000 |
2001 |
2002 |
2003 |
2004 |
2005 |
2006 |
2007 |
2008 |
2009 |
2010 |
2,237 |
2,481 |
2,411 |
2,384 |
2,413 |
2,175 |
2,007 |
2,484 |
2,805 |
2,855 |
2,744 |
2011 |
2012 |
2013 |
2014 |
2015 |
|
|
|
|
|
|
3,087 |
3,132 |
3,311 |
3,467 |
3,858 |
|
|
|
|
|
|
|
| |
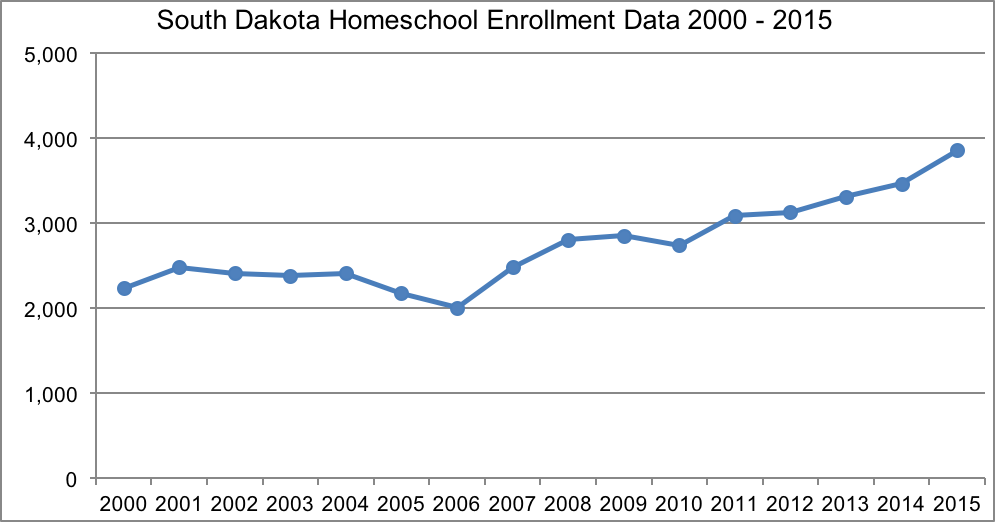 |
South Dakota data obtained from:
2010-2016: |
|
| |
2000 |
2001 |
2002 |
2003 |
2004 |
2005 |
2006 |
2007 |
2008 |
2009 |
2010 |
N/A |
N/A |
7,037 |
7,037 |
6,950 |
7,573 |
8,540 |
8,808 |
8,895 |
9,177 |
8,154 |
2011 |
2012 |
2013 |
2014 |
2015 |
2016 |
|
|
|
|
|
8,023 |
8,260 |
8,988 |
10,438 |
13,033 |
16,085 |
|
|
|
|
|
|
| |
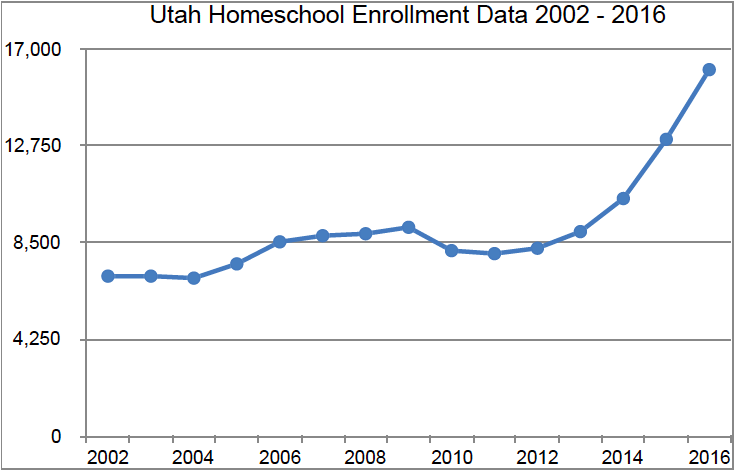 |
Utah data obtained from:
2005-2016:
|
|
| |
2000 |
2001 |
2002 |
2003 |
2004 |
2005 |
2006 |
2007 |
2008 |
2009 |
2010 |
N/A |
N/A |
2,064 |
2,023 |
2,094 |
2,063 |
2,190 |
2,092 |
2,098 |
2,128 |
2,238 |
2011 |
2012 |
2013 |
2014 |
2015 |
2016 |
2017 |
2018 |
2019 |
|
|
2,209 |
2,363 |
2,424 |
2,384 |
2,408 |
2,279 |
2,233 |
2,344 |
2,571 |
|
|
|
| |
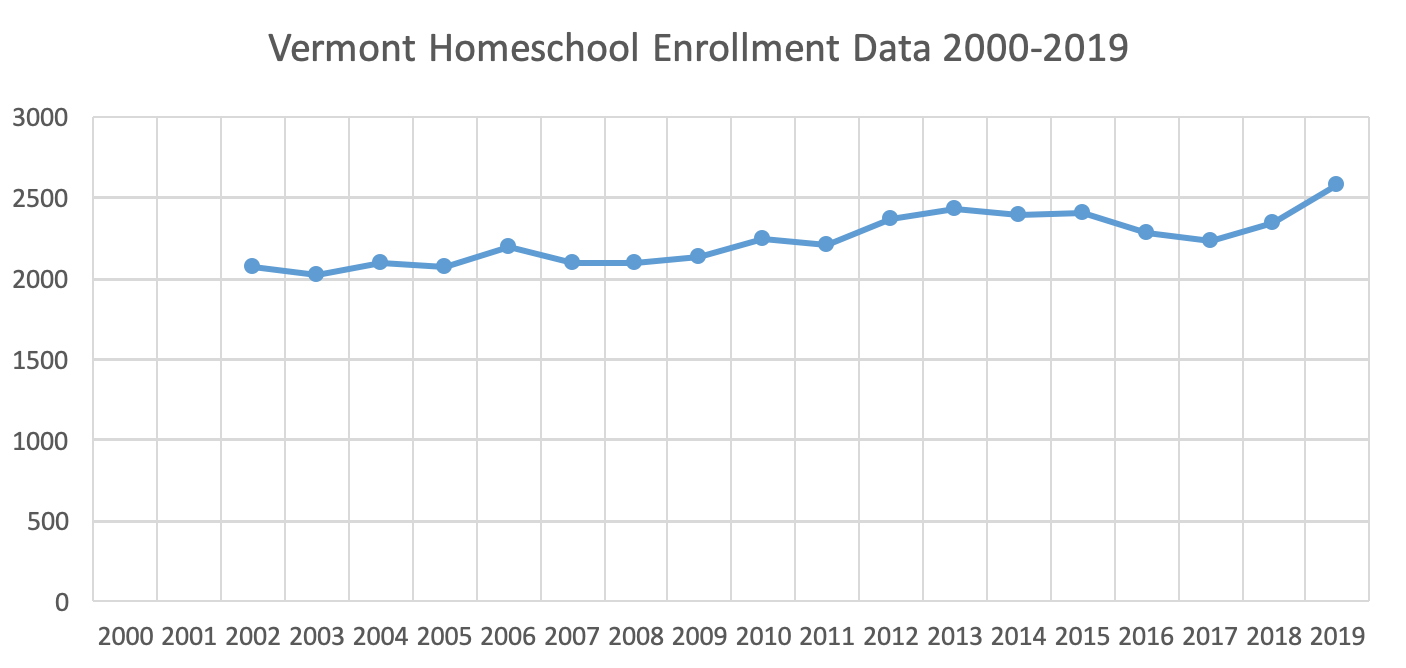 |
Vermont data obtained from:
Karen Agnew:
2015-2016: Emailed Karen Agnew () and Brynne Reed ()
2017-2019: Judy Cutler (Judy.Cutler@vermont.gov)
|
|
| |
2000 |
2001 |
2002 |
2003 |
2004 |
2005 |
2006 |
2007 |
2008 |
2009 |
2010 |
14,323 |
16,268 |
16,542 |
16,400 |
17,448 |
18,693 |
20,240 |
20,694 |
22,621 |
23,290 |
24,682 |
2011 |
2012 |
2013 |
2014 |
2015 |
2016 |
2017 |
2018 |
|
|
|
25,255 |
27,384 |
29,477 |
32,314 |
33,415 |
33,927 |
36,897 |
36,984 |
|
|
|
|
| |
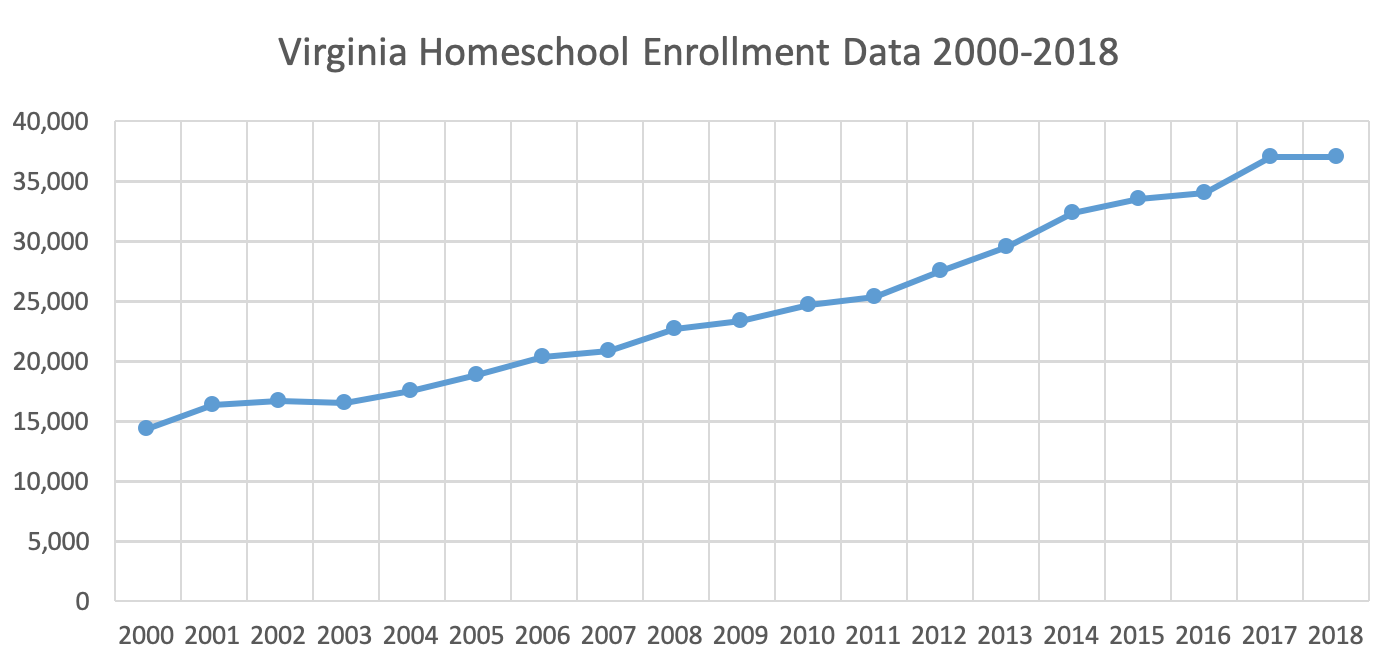 |
Virginia data obtained from:
1994-2018: http://www.doe.virginia.gov/statistics_reports/enrollment/home_school_religious_exempt/index.shtml |
|
| |
2000 |
2001 |
2002 |
2003 |
2004 |
2005 |
2006 |
2007 |
2008 |
2009 |
2010 |
20,433 |
19,481 |
19,554 |
19,337 |
16,468 |
15,819 |
17,577 |
19,541 |
16,577 |
16,792 |
15,187 |
2011 |
2012 |
2013 |
2014 |
2015 |
2016 |
2017 |
2018 |
|
|
|
15,341 |
16,582 |
18,218 |
19,610 |
20,921 |
21,213 |
21,022 |
21,916 |
|
|
|
|
| |
 |
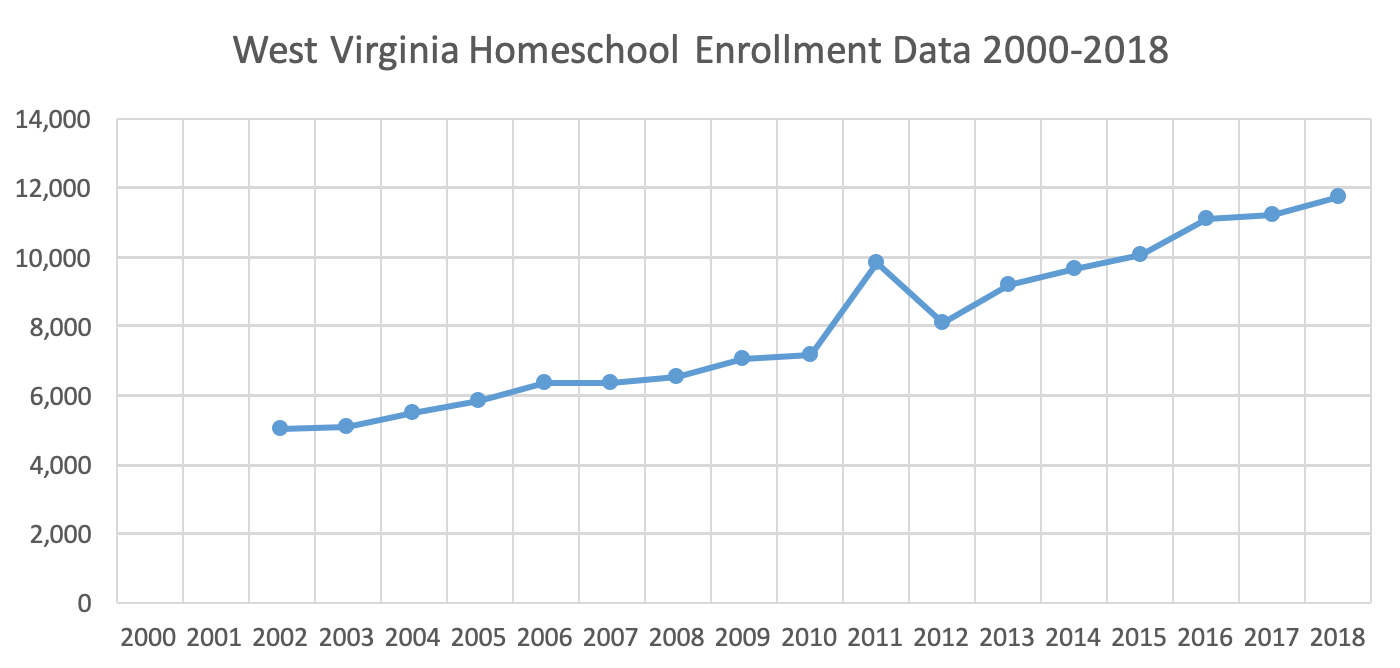
Washington data obtained from:
1987-2016:
2017: http://www.k12.wa.us/PrivateEd/HomeBasedEd/AnnualReports.aspx
2018: https://www.k12.wa.us/student-success/learning-alternatives/home-based-instruction (calculated by adding all district totals together)
|
|
| |
2000 |
2001 |
2002 |
2003 |
2004 |
2005 |
2006 |
2007 |
2008 |
2009 |
2010 |
N/A |
N/A |
5,002 |
5,091 |
5,501 |
5,836 |
6,342 |
6,358 |
6,532 |
7,027 |
7,183 |
2011 |
2012 |
2013 |
2014 |
2015 |
2016 |
2017 |
2018 |
|
|
|
9,811 |
8,081 |
9,199 |
9,616 |
11,069 |
11,075 |
11,196 |
11,699 |
|
|
|
|
| |
 |
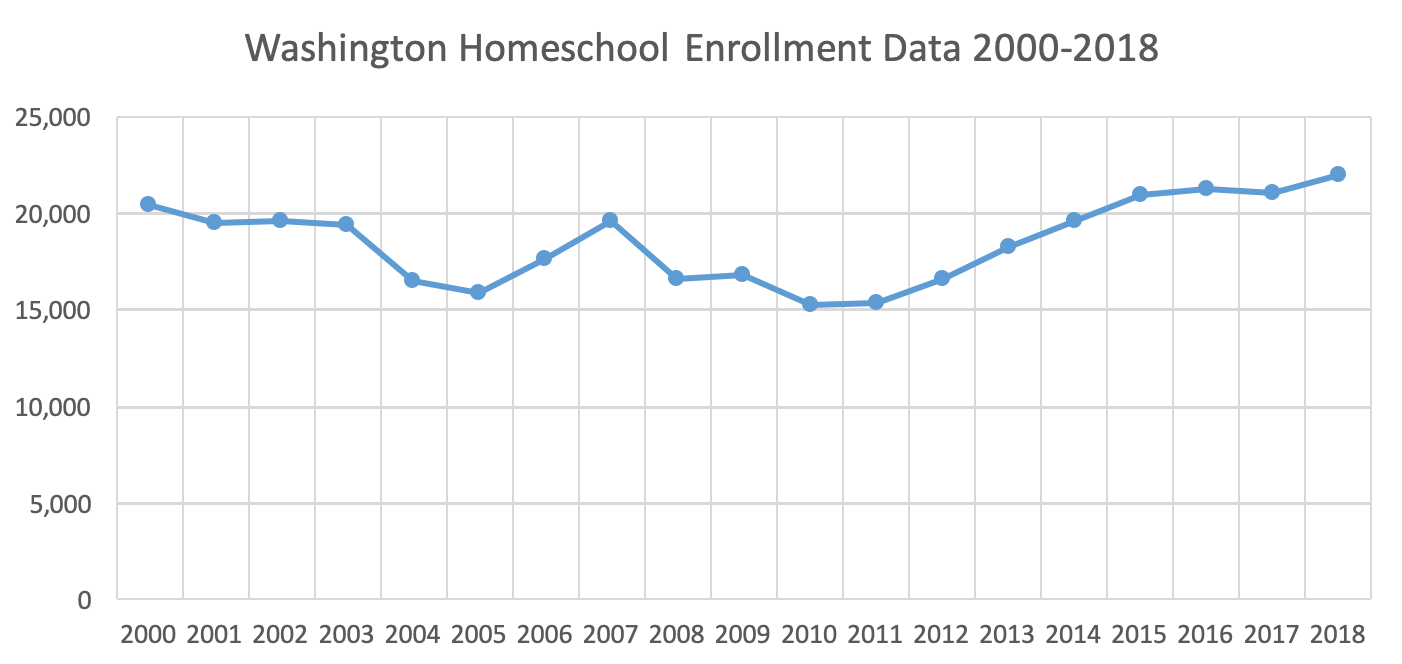
Washington data obtained from:
1987-2016:
2017: http://www.k12.wa.us/PrivateEd/HomeBasedEd/AnnualReports.aspx
2018: https://www.k12.wa.us/student-success/learning-alternatives/home-based-instruction (calculated by adding all district totals together)
|
|
| |
2000 |
2001 |
2002 |
2003 |
2004 |
2005 |
2006 |
2007 |
2008 |
2009 |
2010 |
20,382 |
21,013 |
21,288 |
21,034 |
20,743 |
20,323 |
20,157 |
19,725 |
19,358 |
19,049 |
19,576 |
2011 |
2012 |
2013 |
2014 |
2015 |
2016 |
2017 |
2018 |
|
|
|
18,279 |
18,464 |
19,104 |
19,850 |
20,002 |
20,362 |
21,633 |
21,577 |
|
|
|
|
| |
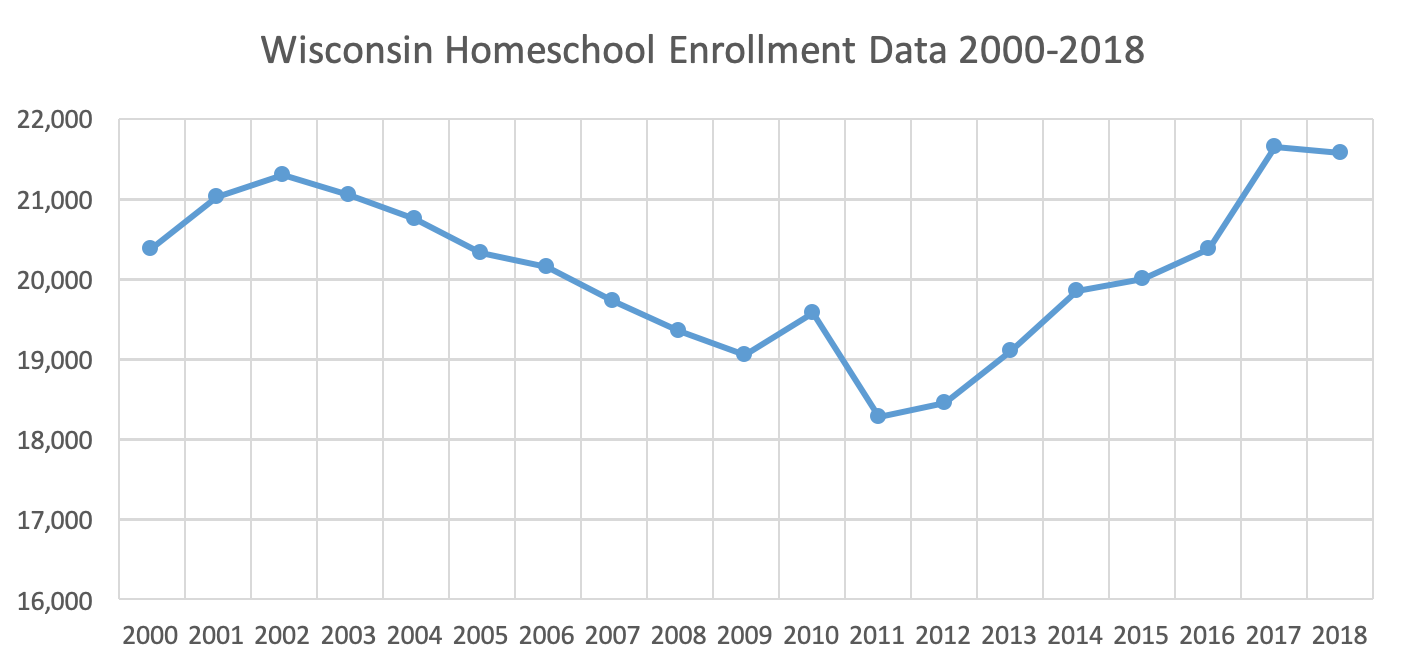 |
Wisconsin data obtain from:
1984-2016:
|
|
| |
2000 |
2001 |
2002 |
2003 |
2004 |
2005 |
2006 |
2007 |
2008 |
2009 |
2010 |
2,000 |
2,101 |
2,216 |
2,093 |
2,287 |
2,322 |
2,381 |
2,443 |
2,548 |
2,325 |
2,246 |
2011 |
2012 |
2013 |
2014 |
2015 |
2016 |
|
|
|
|
|
2,109 |
2,309 |
2,452 |
2,316 |
2,296 |
N/A |
|
|
|
|
|
|
| |
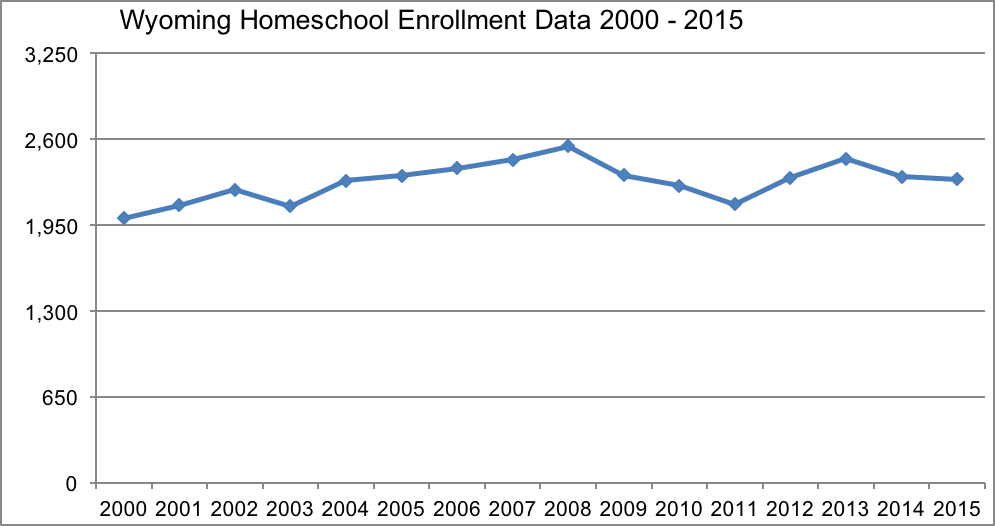 |
Wyoming data obtained from:
Note: Wyoming’s figures only include students who are homeschooled but attend public school for P.E. or other electives.
2010-2014: Emailed and
2015: Obtained information from . She said that they are still finalizing data for 2015-2016, so recheck the number next year
2016:
Check back in September 2017 |
|